Three out of ten engines run on stolen fuel. How did Neotecnik decide to stop this problem?
Track and digitize sales force operations
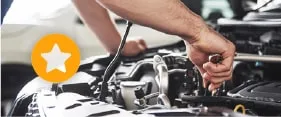
Program and manage all fleet maintenance and generate budgets without the need for additional personnel
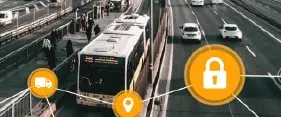
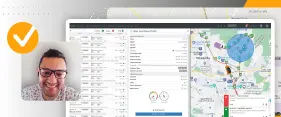
Discover the top 20 solutions and tools for tracking, security, and end customers
Discover how a virtual copilot in MDT terminals meets safety regulations and optimizes operations
How efficient cold chain control drastically reduces losses and damages to goods?
One of the most critical activities in logistics management is asset control...
Three out of ten engines run on stolen fuel. How did Neotecnik decide to stop this problem?
With the right tools and guidance, migration represents an improvement in the service you provide to your customers and strengthens your position against the competition
OnDash is the RedGPS solution that allows you and your clients to create dashboards with charts from data generated by GPS trackers, sensors, the platform, and our AppTracker. It enables monitoring of fleet KPIs, analyzing Asset behavior, understanding how your clients use the platform, detecting bad configurations, and more.
OnDash is a platform developed specifically for our industry, as it helps improve plataform performance and optimize the operational aspects of fleets.
Both you and your clients can create dashboards tailored to your specific information needs. This flexibility streamlines the identification of issues that impact your tracking company and your clients’ fleets, both economically and logistically.
To set up a new dashboard, simply create it in Settings, add the columns that will contain the graph plugins, and organize the information however you prefer.
OnDash works with totalizers that allow you to visualize each KPI—metrics that group specific amounts of data, making it easy, practical, and immediate for users to interpret and understand information.
Totalizers help you track, for example, the number of kilometers traveled, engine hours, idle time, total events generated per day, reports issued, alerts triggered, active users, locations created, incidents captured, and more.
Offer OnDash to your clients. They can review the distances traveled by their assets and easily identify if any asset covers longer distances than others, which may indicate unauthorized use. Logistics managers can access charts displaying distance traveled, idle and active time, triggered alerts, generated events, and much more.
OnDash is also a solution for your GPS tracking business. It helps detect platform or hardware misconfigurations, failures, poor installations, and other irregularities. For example, if a device generates an unusually high number of reports, it could indicate a configuration issue.
OnDash charts data from all sensors installed on your assets—such as temperature, fuel, and tire sensors—allowing you to identify abrupt variations that need analysis and correction, and to centralize all sensor information without downloading reports.
OnDash can display sensor ranges as well as statistics like maximum, minimum, average, initial value, final value, difference, increase, and decrease.
OnDash is also compatible with AppTracker, our field service app. It displays the data and events reported by the app using visualizations of KPIs you need to analyze, such as the distances covered by field agents, events reported with customizable buttons, and the number of forms completed.
OnDash can generate bar, line, pie, and other types of charts. Charts can be viewed in full screen, printed, or downloaded in JPEG, PNG, PDF, SVG, XLS, or CSV formats, giving your GPS tracking business an information-rich yet simple and familiar environment that you can also offer to your clients.
In addition to detecting anomalies and misconfigurations on the platform or in the programming of GPS devices, OnDash provides an "x-ray" view that helps you understand how your customers use the plataform. It does this by leveraging data that, until now, there was no way to centralize.
As a distributor, you can view information on all your clients, see the number of reports from GPS devices, and know if any devices are generating an unusual amount of them. You can also monitor tickets, users, and events, and see which clients are creating too many alerts, and more.
If you're already a customer, log in to the plataform to explore it. If not, click the image below or fill out the form at the bottom so we can get in touch and offer you a demo.
Unleash all the potential OnDash has for you, leverage the information it offers to make decisions, and help your clients go further.